
Sign in
For Photos4Travel editors and team members.
TOURISM REFERENCE · 2007–2025
Most Visited Countries
Compare international arrivals by year, read the source notes and download the data behind the tables and recovery chart.
Which country gets the most visitors?
France is the largest destination in the 2025 figures shown here, with an estimated 102 million international arrivals. Spain reports 96.8 million, followed by the United States at 68.3 million.
The 2025 table is a selection with available data. The selected UN Tourism dashboard release has no 2025 values for the United Kingdom, Germany or China. France uses a separate Atout France estimate. The numbered positions are among the countries listed, rather than a complete world ranking.
Page updated 13 November 2026. Dashboard panel: September 2026. Historical publication dates and the separate downloadable-data release are identified below each table.
Choose a reference year
Select a year to open its table and source notes. Arrival totals count trips or recorded arrivals, rather than unique people. They do not predict the crowds at a particular attraction.
Publication editions can revise earlier years. Compare like-for-like series within the same release; a difference between two source vintages does not by itself identify an error.
2025: international tourist arrivals
On a small screen, scroll this table sideways. Keyboard: focus the table and use the arrow keys.
| Position in this table | Country | Arrivals (2025) | Change vs 2024 |
|---|---|---|---|
| 1 | France | 102.0 million (estimate) | — |
| 2 | Spain | 96.8 million | +3.2% |
| 3 | United States | 68.3 million | −5.5% |
| 4 | Turkey | 62.0 million | +2.4% |
| 5 | Italy | 61.3 million | +6.3% |
| 6 | Mexico | 47.8 million | +6.1% |
| 7 | Japan | 42.7 million | +15.8% |
| 8 | Greece | 38.0 million | +5.6% |
| 9 | Austria | 33.5 million | +5.0% |
| 10 | Thailand | 33.0 million | −7.2% |
Source: UN Tourism Data Dashboard, Tourist Arrivals → Annual, panel labelled “UN Tourism, September 2026”, country-filtered data tables, consulted 13 November 2026. Open the interactive source. The dashboard home reports an update on 11 November 2026; that is separate from the Annual panel’s edition label. France: Atout France, Bilan touristique de l’année 2025, 19 February 2026, p. 1, estimate of 102 million international arrivals.
Available-data selection, not a complete global top 10. The dashboard has no 2025 value for France, the United Kingdom, Germany or China in this edition. France is added from the separate national estimate. Japan uses visitor arrivals at the border (VF, potentially including same-day visits); Austria uses accommodation arrivals (TCE); the other dashboard rows use border tourists (TF). Growth rates are the dashboard’s own rates, not calculations from these rounded values. France therefore has no growth figure. Italy’s 61.3 million is the dashboard value. Banca d’Italia’s 26 June 2026 survey, Table 2, p. 8, reports 61.4 million for 2025 and 57.8 million for 2024. Those survey figures are not substituted into the dashboard series. Türkiye’s 62.0 million is the dashboard TF series; a national total of all visitors measures a different population.
For the stories behind these figures, read our analysis of tourism’s winners and losers in 2025.
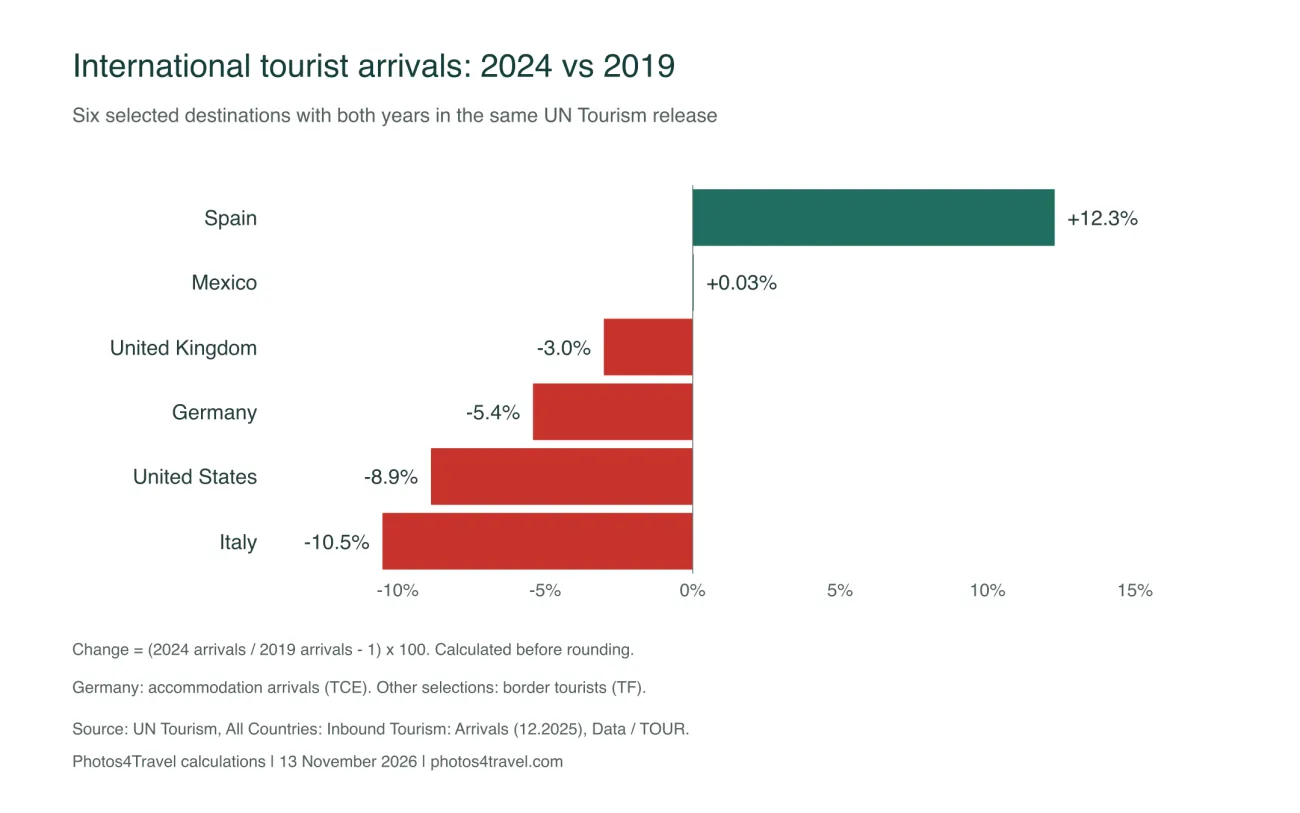
How did 2024 arrivals compare with 2019?
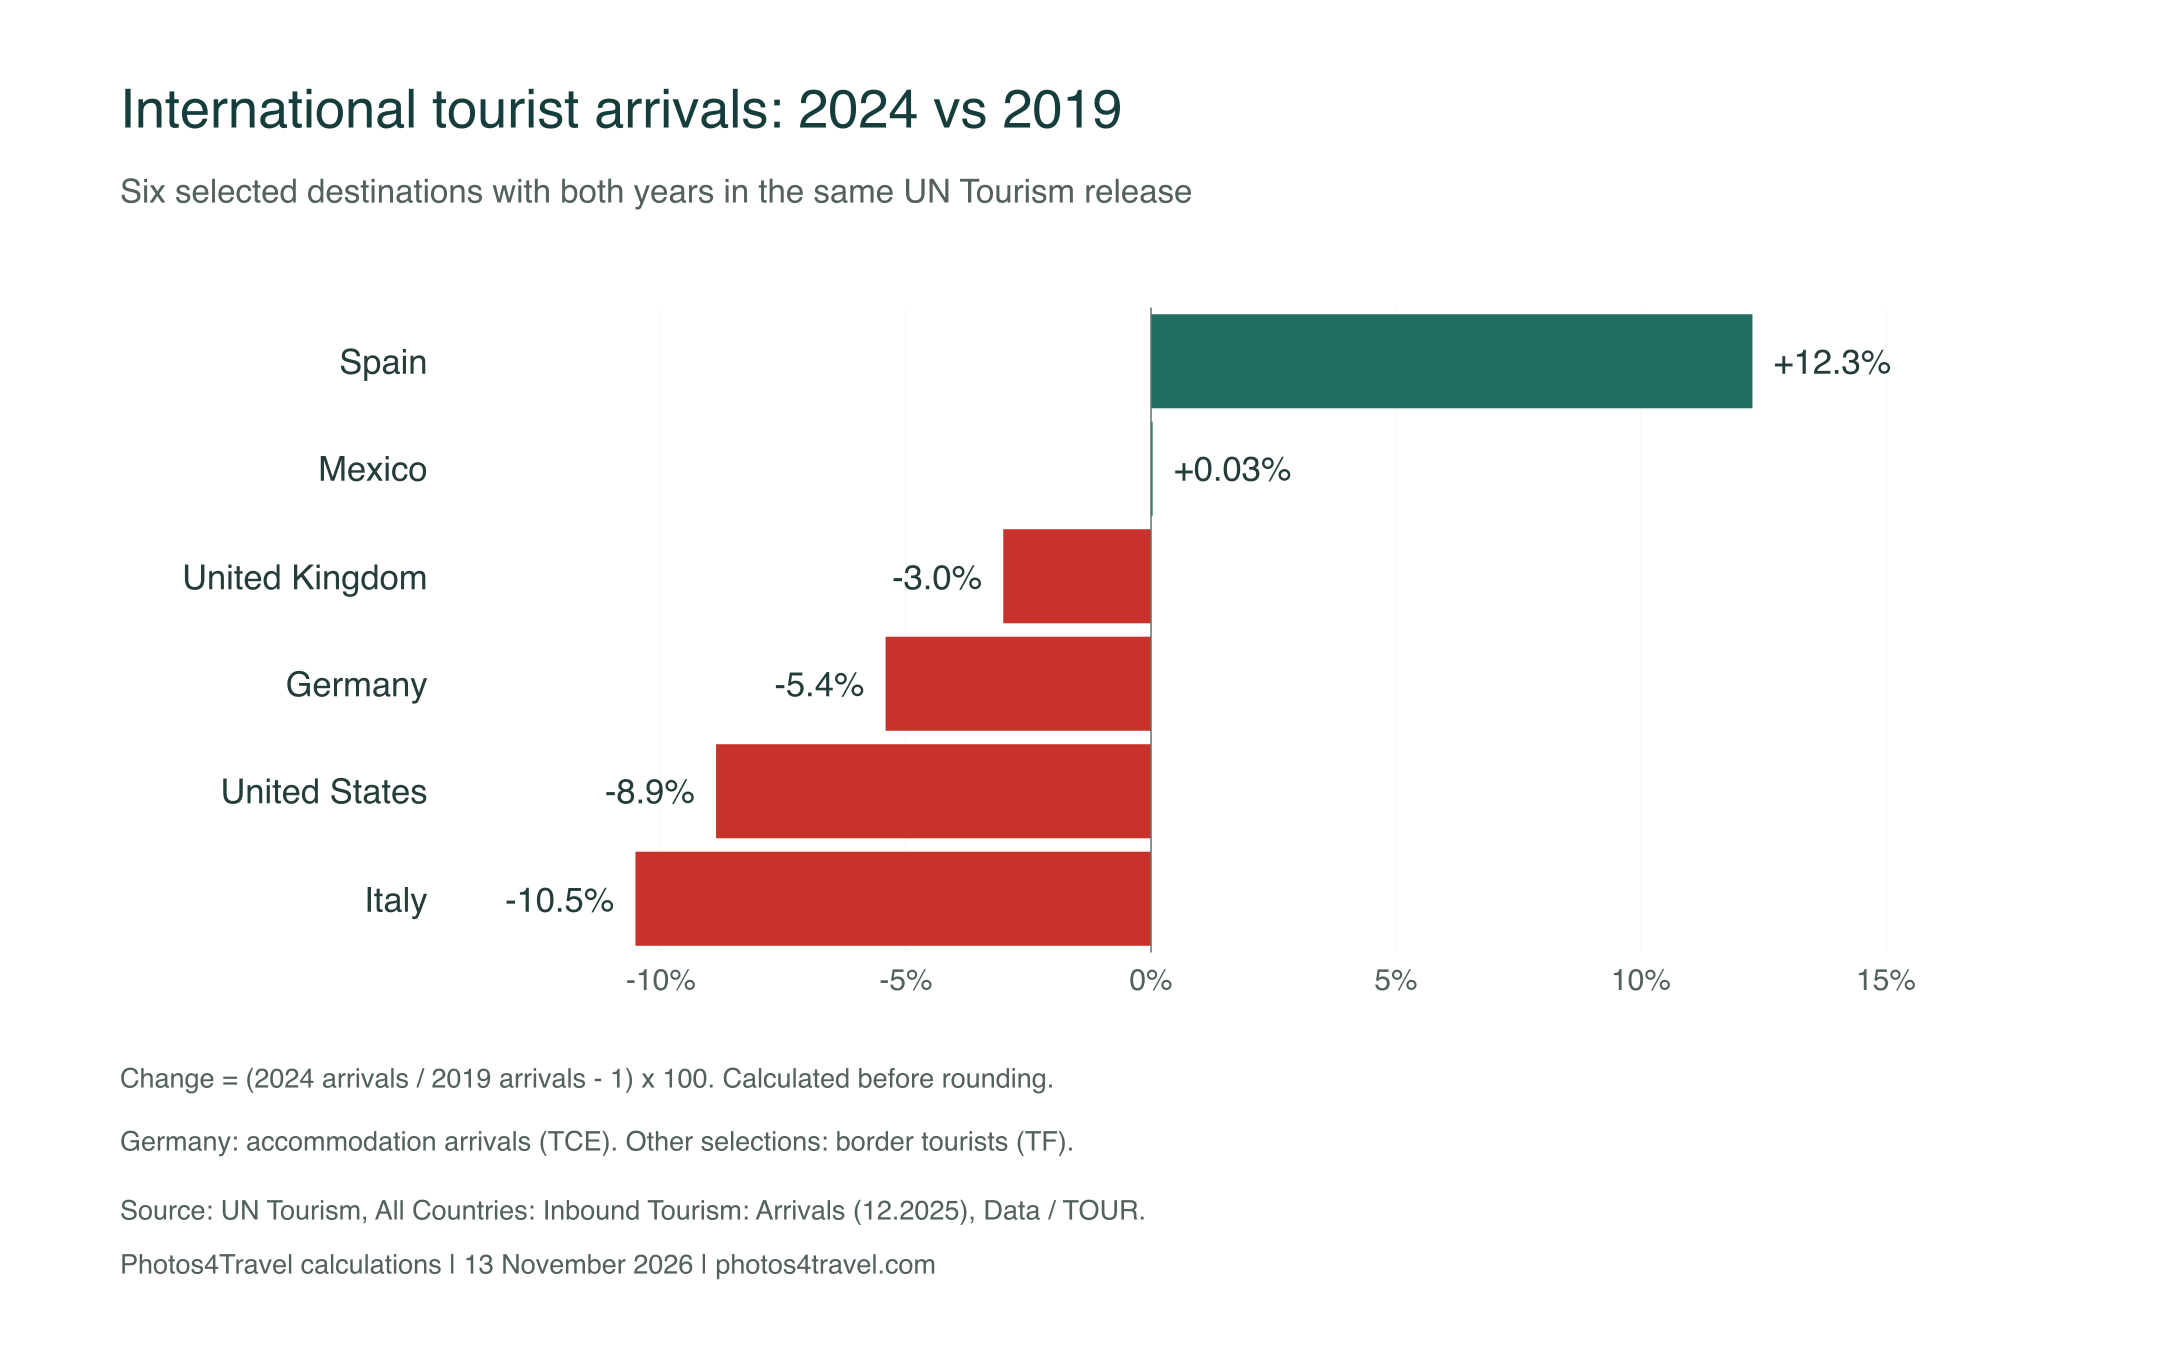
Spain recorded 12.3% more international tourist arrivals than in 2019 in this six-country comparison. Mexico was almost level, at +0.03%. The United Kingdom, Germany, the United States and Italy remained below their 2019 totals in this particular data release.
The calculation uses the exact 2019 and 2024 observations from one downloadable UN Tourism workbook. These six destinations are selected examples with both years available, rather than a ranking of global recovery.
On a small screen, scroll this table sideways. Keyboard: focus the table and use the arrow keys.
| Country | 2019 (million) | 2024 (million) | Change | Series |
|---|---|---|---|---|
| Spain | 83.509 | 93.759 | +12.3% | TF |
| Mexico | 45.024 | 45.039 | +0.03% | TF |
| United Kingdom | 39.418 | 38.230 | -3.0% | TF |
| Germany | 39.563 | 37.420 | -5.4% | TCE |
| United States | 79.442 | 72.390 | -8.9% | TF |
| Italy | 64.513 | 57.725 | -10.5% | TF |
Source: UN Tourism, All Countries: Inbound Tourism: Arrivals 1995–2024 (12.2025), internal release 23 December 2025, worksheet Data, indicator INBD_TRIP_TOTL_TOTL_TOUR. The download URL contains “2026-09”; that path is not the workbook’s internal release date. Change = (2024 ÷ 2019 − 1) × 100, calculated before rounding.
TF means tourists recorded at the border, excluding same-day visitors. Germany uses TCE, arrivals in collective tourist accommodation. These collection methods have different coverage. The comparison deliberately uses one workbook version for both years; the annual tables use the dashboard or dated historical publications. For example, the workbook’s US 2024 value is 72.390321 million, while the dashboard shows 72.3 million. The source vintages are kept separate.
Download the tables and chart
The Excel workbook includes the 17 annual tables, row-level sources, measurement notes and the formulas for the six-country comparison. Source precision is retained for the calculation; the page rounds arrival figures for reading.
Compiled and calculated by Photos4Travel. The About & use tab gives source credits, a suggested citation and guidance for quoting figures while retaining their estimate, measurement, coverage and version notes.
Download the data and calculations (XLSX) Open the chart (PNG)
Suggested citation: Photos4Travel, Most Visited Countries, updated 13 November 2026. When using a figure, also name the UN Tourism or national publication and its edition shown in the corresponding source note.
2024 · Table and sources
2024: international tourist arrivals
On a small screen, scroll this table sideways. Keyboard: focus the table and use the arrow keys.
| Rank | Country | Arrivals (2024) |
|---|---|---|
| 1 | France | 102.2 million |
| 2 | Spain | 93.8 million |
| 3 | United States | 72.3 million |
| 4 | Turkey | 60.6 million |
| 5 | Italy | 57.7 million |
| 6 | Mexico | 45.0 million |
| 7 | United Kingdom | 38.2 million |
| 8 | Germany | 37.4 million |
| 9 | Japan | 36.9 million |
| 10 | Greece | 36.0 million |
Source: UN Tourism Data Dashboard, Tourist Arrivals → Annual, panel labelled “UN Tourism, September 2026”, country-filtered data tables, consulted 13 November 2026. Open the interactive source. The dashboard home reports an update on 11 November 2026; that is separate from the Annual panel’s edition label.
Coverage depends on the available country series. These totals are arrivals, not unique people. Germany and Austria use accommodation-based reporting; countries may use different border or lodging coverage. The US value of 72.3 million follows this dashboard edition; the separate 12.2025 downloadable workbook gives 72.390321 million. Italy’s dashboard value is 57.7 million; the later national survey gives 57.8 million. The versions are identified rather than silently mixed.
2023 · Table and sources
2023: international tourist arrivals
On a small screen, scroll this table sideways. Keyboard: focus the table and use the arrow keys.
| Rank | Country | Arrivals (2023) |
|---|---|---|
| 1 | France | 100.2 million |
| 2 | Spain | 85.2 million |
| 3 | United States | 66.3 million |
| 4 | Italy | 57.2 million |
| 5 | Turkey | 55.2 million |
| 6 | Mexico | 41.9 million |
| 7 | United Kingdom | 37.2 million |
| 8 | Germany | 34.7 million |
| 9 | China | 34.3 million |
| 10 | Greece | 32.7 million |
Source: UN Tourism Data Dashboard, Tourist Arrivals → Annual, panel labelled “UN Tourism, September 2026”, country-filtered data tables, consulted 13 November 2026. Open the interactive source. The dashboard home reports an update on 11 November 2026; that is separate from the Annual panel’s edition label.
Coverage depends on the available country series. These totals are arrivals, not unique people. Germany and Austria use accommodation-based reporting; countries may use different border or lodging coverage.
2022 · Table and sources
2022: international tourist arrivals
On a small screen, scroll this table sideways. Keyboard: focus the table and use the arrow keys.
| Rank | Country | Arrivals (2022) |
|---|---|---|
| 1 | France | 93.2 million |
| 2 | Spain | 71.7 million |
| 3 | United States | 50.8 million |
| 4 | Turkey | 50.5 million |
| 5 | Italy | 49.8 million |
| 6 | Mexico | 38.3 million |
| 7 | United Kingdom | 30.7 million |
| 8 | Germany | 28.4 million |
| 9 | Greece | 27.8 million |
| 10 | Austria | 26.2 million |
Source: UN Tourism Data Dashboard, Tourist Arrivals → Annual, panel labelled “UN Tourism, September 2026”, country-filtered data tables, consulted 13 November 2026. Open the interactive source. The dashboard home reports an update on 11 November 2026; that is separate from the Annual panel’s edition label.
Coverage depends on the available country series. These totals are arrivals, not unique people. Germany and Austria use accommodation-based reporting; countries may use different border or lodging coverage.
2021 · Table and sources
2021: international tourist arrivals
On a small screen, scroll this table sideways. Keyboard: focus the table and use the arrow keys.
| Rank | Country | Arrivals (2021) |
|---|---|---|
| 1 | France | 48.4 million |
| 2 | Mexico | 31.9 million |
| 3 | Spain | 31.2 million |
| 4 | Turkey | 29.9 million |
| 5 | Italy | 26.9 million |
| 6 | United States | 22.3 million |
| 7 | Greece | 14.7 million |
| 8 | Austria | 12.7 million |
| 9 | Germany | 11.7 million |
| 10 | United Arab Emirates | 11.5 million |
Source: UN Tourism Data Dashboard, Tourist Arrivals → Annual, panel labelled “UN Tourism, September 2026”, country-filtered data tables, consulted 13 November 2026. Open the interactive source. The dashboard home reports an update on 11 November 2026; that is separate from the Annual panel’s edition label. The United Arab Emirates row is verified separately against the downloadable 12.2025 TOUR series, worksheet Data, year 2021, rounded to one decimal million.
Coverage depends on the available country series. These totals are arrivals, not unique people. Germany and Austria use accommodation-based reporting; countries may use different border or lodging coverage.
2020 · Table and sources
2020: international tourist arrivals
On a small screen, scroll this table sideways. Keyboard: focus the table and use the arrow keys.
| Rank | Country | Arrivals (2020) |
|---|---|---|
| 1 | France | 41.7 million |
| 2 | Italy | 25.2 million |
| 3 | Mexico | 24.3 million |
| 4 | United States | 19.2 million |
| 5 | Spain | 18.9 million |
| 6 | Turkey | 15.9 million |
| 7 | Austria | 15.1 million |
| 8 | Germany | 12.4 million |
| 9 | United Kingdom | 10.7 million |
| 10 | Poland | 8.4 million |
Source: UN Tourism Data Dashboard, Tourist Arrivals → Annual, panel labelled “UN Tourism, September 2026”, country-filtered data tables, consulted 13 November 2026. Open the interactive source. The dashboard home reports an update on 11 November 2026; that is separate from the Annual panel’s edition label. The Poland row is verified separately against the downloadable 12.2025 TOUR series, worksheet Data, year 2020, rounded to one decimal million.
Coverage depends on the available country series. These totals are arrivals, not unique people. Germany and Austria use accommodation-based reporting; countries may use different border or lodging coverage.
2019 · Table and sources
2019: international tourist arrivals
On a small screen, scroll this table sideways. Keyboard: focus the table and use the arrow keys.
| Rank | Country | Arrivals (2019) |
|---|---|---|
| 1 | France | 90.9 million |
| 2 | Spain | 83.5 million |
| 3 | United States | 79.4 million |
| 4 | China | 65.7 million |
| 5 | Italy | 64.5 million |
| 6 | Turkey | 51.2 million |
| 7 | Mexico | 45.0 million |
| 8 | Thailand | 39.9 million |
| 9 | Germany | 39.6 million |
| 10 | United Kingdom | 39.4 million |
Source: UN Tourism Data Dashboard, Tourist Arrivals → Annual, panel labelled “UN Tourism, September 2026”, country-filtered data tables, consulted 13 November 2026. Open the interactive source. The dashboard home reports an update on 11 November 2026; that is separate from the Annual panel’s edition label.
Coverage depends on the available country series. These totals are arrivals, not unique people. Germany and Austria use accommodation-based reporting; countries may use different border or lodging coverage.
2018 · Table and sources
2018: international tourist arrivals
On a small screen, scroll this table sideways. Keyboard: focus the table and use the arrow keys.
| Rank | Country | Arrivals (2018) |
|---|---|---|
| 1 | France | 89.3 million |
| 2 | Spain | 82.8 million |
| 3 | United States | 79.7 million |
| 4 | China | 62.9 million |
| 5 | Italy | 61.6 million |
| 6 | Turkey | 45.8 million |
| 7 | Mexico | 41.3 million |
| 8 | Germany | 38.9 million |
| 9 | United Kingdom | 38.7 million |
| 10 | Thailand | 38.2 million |
Source: UN Tourism Data Dashboard, Tourist Arrivals → Annual, panel labelled “UN Tourism, September 2026”, country-filtered data tables, consulted 13 November 2026. Open the interactive source. The dashboard home reports an update on 11 November 2026; that is separate from the Annual panel’s edition label.
Coverage depends on the available country series. These totals are arrivals, not unique people. Germany and Austria use accommodation-based reporting; countries may use different border or lodging coverage.
2017 · Table and sources
2017: international tourist arrivals
On a small screen, scroll this table sideways. Keyboard: focus the table and use the arrow keys.
| Rank | Country | Arrivals (2017) |
|---|---|---|
| 1 | France | 86.8 million |
| 2 | Spain | 81.9 million |
| 3 | United States | 77.2 million |
| 4 | China | 60.7 million |
| 5 | Italy | 58.3 million |
| 6 | United Kingdom | 39.5 million |
| 7 | Mexico | 39.3 million |
| 8 | Turkey | 37.6 million |
| 9 | Germany | 37.5 million |
| 10 | Thailand | 35.6 million |
Source: UN Tourism Data Dashboard, Tourist Arrivals → Annual, panel labelled “UN Tourism, September 2026”, country-filtered data tables, consulted 13 November 2026. Open the interactive source. The dashboard home reports an update on 11 November 2026; that is separate from the Annual panel’s edition label.
Coverage depends on the available country series. These totals are arrivals, not unique people. Germany and Austria use accommodation-based reporting; countries may use different border or lodging coverage.
2016 · Table and sources
2016: international tourist arrivals
On a small screen, scroll this table sideways. Keyboard: focus the table and use the arrow keys.
| Rank | Country | Arrivals (2016) |
|---|---|---|
| 1 | France | 82.7 million |
| 2 | United States | 76.4 million |
| 3 | Spain | 75.3 million |
| 4 | China | 59.3 million |
| 5 | Italy | 52.4 million |
| 6 | United Kingdom | 37.4 million |
| 7 | Germany | 35.6 million |
| 8 | Mexico | 35.1 million |
| 9 | Thailand | 32.5 million |
| 10 | Turkey | 30.3 million |
Source: UN Tourism Data Dashboard, Tourist Arrivals → Annual, panel labelled “UN Tourism, September 2026”, country-filtered data tables, consulted 13 November 2026. Open the interactive source. The dashboard home reports an update on 11 November 2026; that is separate from the Annual panel’s edition label.
Coverage depends on the available country series. These totals are arrivals, not unique people. Germany and Austria use accommodation-based reporting; countries may use different border or lodging coverage.
2013 · Table and sources
2013: international tourist arrivals
On a small screen, scroll this table sideways. Keyboard: focus the table and use the arrow keys.
| Rank | Country | Arrivals (2013) |
|---|---|---|
| 1 | France | 84.7 million |
| 2 | United States | 69.8 million |
| 3 | Spain | 60.7 million |
| 4 | China | 55.7 million |
| 5 | Italy | 47.7 million |
| 6 | Turkey | 37.8 million |
| 7 | Germany | 31.5 million |
| 8 | United Kingdom | 31.2 million |
| 9 | Russia | 28.4 million |
| 10 | Thailand | 26.5 million |
Source: UNWTO World Tourism Barometer, Volume 13, January 2015, Statistical Annex, Data as collected by UNWTO January 2015, Annex–10 (PDF page 10), International Tourist Arrivals by Country of Destination, 2013 column.
TF: border tourists, excluding same-day visitors. Germany uses TCE, collective accommodation arrivals. Figures retain this publication’s historical snapshot; later editions may revise them.
2012 · Table and sources
2012: international tourist arrivals
On a small screen, scroll this table sideways. Keyboard: focus the table and use the arrow keys.
| Rank | Country | Arrivals (2012) |
|---|---|---|
| 1 | France | 83.0 million |
| 2 | United States | 67.0 million |
| 3 | China | 57.7 million |
| 4 | Spain | 57.7 million |
| 5 | Italy | 46.4 million |
| 6 | Turkey | 35.7 million |
| 7 | Germany | 30.4 million |
| 8 | United Kingdom | 29.3 million |
| 9 | Russia | 25.7 million |
| 10 | Malaysia | 25.0 million |
Source: UNWTO Tourism Highlights, 2013 Edition, Data as collected by UNWTO June 2013, pp. 6 and 8–10: 2012 column. Publication DOI.
TF: border tourists, excluding same-day visitors. Germany uses TCE, collective accommodation arrivals. Figures retain this publication’s historical snapshot; later editions may revise them. China (57.725 million) is above Spain (57.701 million) before both round to 57.7 million.
2011 · Table and sources
2011: international tourist arrivals
On a small screen, scroll this table sideways. Keyboard: focus the table and use the arrow keys.
| Rank | Country | Arrivals (2011) |
|---|---|---|
| 1 | France | 81.6 million |
| 2 | United States | 62.7 million |
| 3 | China | 57.6 million |
| 4 | Spain | 56.2 million |
| 5 | Italy | 46.1 million |
| 6 | Turkey | 34.7 million |
| 7 | United Kingdom | 29.3 million |
| 8 | Germany | 28.4 million |
| 9 | Malaysia | 24.7 million |
| 10 | Mexico | 23.4 million |
Source: UNWTO Tourism Highlights, 2013 Edition, Data as collected by UNWTO June 2013, pp. 6 and 8–10: 2011 column; Mexico 23,403 thousand on p. 10. Publication DOI.
TF: border tourists, excluding same-day visitors. Germany uses TCE, collective accommodation arrivals. Figures retain this publication’s historical snapshot; later editions may revise them. The 2011 observations are sorted independently: United Kingdom 7th, Germany 8th, Malaysia 9th and Mexico 10th. The source’s printed ranking refers to 2012.
2010 · Table and sources
2010: international tourist arrivals
On a small screen, scroll this table sideways. Keyboard: focus the table and use the arrow keys.
| Rank | Country | Arrivals (2010) |
|---|---|---|
| 1 | France | 76.80 million |
| 2 | United States | 59.75 million |
| 3 | China | 55.67 million |
| 4 | Spain | 52.68 million |
| 5 | Italy | 43.63 million |
| 6 | United Kingdom | 28.13 million |
| 7 | Turkey | 27.00 million |
| 8 | Germany | 26.88 million |
| 9 | Malaysia | 24.58 million |
| 10 | Mexico | 22.40 million |
Source: UNWTO Tourism Highlights, 2011 Edition, Data as collected by UNWTO, June 2011, printed pp. 5–7 (PDF pages 6–8), regional International Tourist Arrivals tables, 2010 column. Publication DOI.
TF: border tourists, excluding same-day visitors. Germany uses TCE, collective accommodation arrivals. Figures retain this publication’s historical snapshot; later editions may revise them.
2009 · Table and sources
2009: international tourist arrivals
On a small screen, scroll this table sideways. Keyboard: focus the table and use the arrow keys.
| Rank | Country | Arrivals (2009) |
|---|---|---|
| 1 | France | 74.2 million |
| 2 | United States | 54.9 million |
| 3 | Spain | 52.2 million |
| 4 | China | 50.9 million |
| 5 | Italy | 43.2 million |
| 6 | United Kingdom | 28.0 million |
| 7 | Turkey | 25.5 million |
| 8 | Germany | 24.2 million |
| 9 | Malaysia | 23.6 million |
| 10 | Mexico | 21.5 million |
Source: UNWTO Tourism Highlights, 2010 Edition, Data as collected by UNWTO, August 2010, printed p. 5 (PDF page 6), International Tourist Arrivals. Publication DOI.
TF: border tourists, excluding same-day visitors. Germany uses TCE, collective accommodation arrivals. Figures retain this publication’s historical snapshot; later editions may revise them.
2008 · Table and sources
2008: international tourist arrivals
On a small screen, scroll this table sideways. Keyboard: focus the table and use the arrow keys.
| Rank | Country | Arrivals (2008) |
|---|---|---|
| 1 | France | 79.3 million |
| 2 | United States | 58.0 million |
| 3 | Spain | 57.3 million |
| 4 | China | 53.0 million |
| 5 | Italy | 42.7 million |
| 6 | United Kingdom | 30.2 million |
| 7 | Ukraine | 25.4 million |
| 8 | Turkey | 25.0 million |
| 9 | Germany | 24.9 million |
| 10 | Mexico | 22.6 million |
Source: UNWTO Tourism Highlights, 2009 Edition, Data as collected by UNWTO, 2009, printed p. 5 (PDF page 6), International Tourist Arrivals; regional details pp. 5–7. Publication DOI.
TF: border tourists, excluding same-day visitors. Germany uses TCE, collective accommodation arrivals. Figures retain this publication’s historical snapshot; later editions may revise them. This 2009 edition reports the United Kingdom at 30.2 million.
2007 · Table and sources
2007: international tourist arrivals
On a small screen, scroll this table sideways. Keyboard: focus the table and use the arrow keys.
| Position in this table | Country / destination | Arrivals (2007) |
|---|---|---|
| 1 | France | 80.853 million |
| 2 | Spain | 58.666 million |
| 3 | United States | 56.135 million |
| 4 | China | 54.720 million |
| 5 | Italy | 43.654 million |
| 6 | United Kingdom | 30.870 million |
| 7 | Turkey | 26.122 million |
| 8 | Germany | 24.421 million |
| 9 | Ukraine | 23.122 million |
| 10 | Mexico | 21.606 million |
| 11 | Malaysia | 20.973 million |
| 12 | Austria | 20.773 million |
| 13 | Canada | 17.935 million |
| 14 | Hong Kong | 17.154 million |
| 15 | Greece | 16.165 million |
| 16 | Poland | 14.975 million |
| 17 | Thailand | 14.464 million |
| 18 | Macao | 12.945 million |
| 19 | Saudi Arabia | 11.531 million |
| 20 | Netherlands | 11.008 million |
| 21 | Egypt | 10.610 million |
| 22 | Czechia | 9.370 million |
| 23 | Denmark | 9.284 million |
| 24 | South Africa | 9.091 million |
| 25 | Hungary | 8.638 million |
| 26 | Croatia | 8.559 million |
| 27 | Switzerland | 8.448 million |
| 28 | Ireland | 8.332 million |
| 29 | Singapore | 7.957 million |
| 30 | Morocco | 7.408 million |
| 31 | Belgium | 7.045 million |
| 32 | Portugal | 6.788 million |
| 33 | Tunisia | 6.762 million |
| 34 | Sweden | 5.224 million |
| 35 | Bulgaria | 5.151 million |
| 36 | India | 5.082 million |
| 37 | Brazil | 5.026 million |
| 38 | Bahrain | 4.935 million |
| 39 | Argentina | 4.562 million |
| 40 | Norway | 4.377 million |
| 41 | Syria | 4.158 million |
| 42 | Dominican Republic | 3.980 million |
| 43 | Kazakhstan | 3.876 million |
| 44 | Puerto Rico | 3.687 million |
| 45 | Finland | 3.519 million |
| 46 | Jordan | 3.431 million |
| 47 | Philippines | 3.092 million |
| 48 | Chile | 2.507 million |
| 49 | New Zealand | 2.434 million |
| 50 | Cyprus | 2.416 million |
Source: UN Tourism, All Countries: Inbound Tourism: Arrivals 1995–2024 (12.2025), internal release 23 December 2025, worksheet Data, indicator INBD_TRIP_TOTL_TOTL_TOUR. Values in thousand trips are converted to millions. Sorted by exact numeric observations before display rounding.
This is not an exhaustive world top 50. It shows the largest 50 of the 192 numeric 2007 overnight-tourist records available in this single workbook. Japan, Australia, Indonesia, Vietnam, the United Arab Emirates and South Korea lack this selected 2007 tourist series, even where visitor data exist. They are omitted, not counted as zero. Country reporting coverage varies and may be accommodation-based. Territories are included when separately reported. The file’s URL contains “2026-09”, while its internal release is dated 23 December 2025 and carries a transitional data-collection notice. These revised values are not the 2008 Tourism Highlights snapshot.
Definitions, coverage and source editions
What does an arrival measure?
An international tourist arrival is an overnight visitor’s arrival recorded by the reporting system. One person can generate several arrivals across separate trips or destinations. Visitor series (VF) can also include same-day visitors, while accommodation series (TCE) count arrivals at covered lodging establishments. The 2025 note identifies Japan’s visitor series and Austria’s accommodation series.
Why are some countries or years missing?
Missing data are not zero. The 2025 selection leaves out countries without a value in the chosen release. The 2007 table is the largest 50 available overnight-tourist records from one downloadable release, whose coverage differs from visitor-based tables. Hong Kong, Macao and other separately reported destinations may appear alongside countries. The historical series on this page does not include 2014 or 2015; no values have been interpolated.
Why can two official sources show different values?
Publications can revise survey estimates, reporting coverage or earlier submissions. Each annual table retains one identified version. France’s 2025 estimate is not combined with a dashboard growth rate. National releases may also use a different population, such as all departing visitors rather than overnight tourists.
How are ranks and percentages calculated?
Where exact observations are available, ordering uses the unrounded values. In the 2012 publication, China’s 57.725 million is above Spain’s 57.701 million, although both display as 57.7 million. The 2011 order is calculated from that year’s values, rather than copied from the publication’s 2012 order. The 2025 growth column is the dashboard’s reported rate, not a calculation from the rounded numbers displayed here.
For the most recent revisions, visit the UN Tourism Data Dashboard or the official inbound tourism download page.
Turn a ranking into a travel plan
Start with the regional travel list to narrow your choices. Then use Travel Guides for practical destination planning. National arrival totals do not describe the experience of a specific city, island or walking route.
Official reference: UN Tourism Data Dashboard. Consult the official source for revisions and the latest reporting coverage.